One source of truth for accounting officers managing many books.
PikoHANA is a multi-company accounting dashboard. I redesigned the onboarding, consolidation and reporting flows so accounting officers can move from spreadsheets to a trustworthy single view of every entity they manage.
Spreadsheets, Xero exports and a lot of copy-paste.
Every month, accounting officers rebuilt the same consolidation by hand. The product had to absorb that work without losing the trust those spreadsheets earned.
PikoHANA serves accounting officers (AOs) who manage books for multiple SMBs. The old workflow was spreadsheets + Xero exports, glued together by hand each month.
Onboarding a new company took 2–3 hours. Reports were rebuilt for every client. There was no single, trustworthy view across companies or consolidation groups.
AOs were the bottleneck. Every hour saved on data wrangling was an hour they could spend advising the business — the actual product they sell.
Six AOs, one month of close, four insights.
I shadowed accounting officers through a real month-end. The artefacts they trusted were not dashboards — they were named cells in their spreadsheet.
AOs do not need a beautiful chart. They need to know the number is correct, and which import it came from.
Most AOs run 5–15 entities, often as consolidation groups. The IA must treat 'group' as a first-class object, not an afterthought.
Every firm has its own Chart of Accounts and report layout. Drag-to-build beats hard-coded templates.
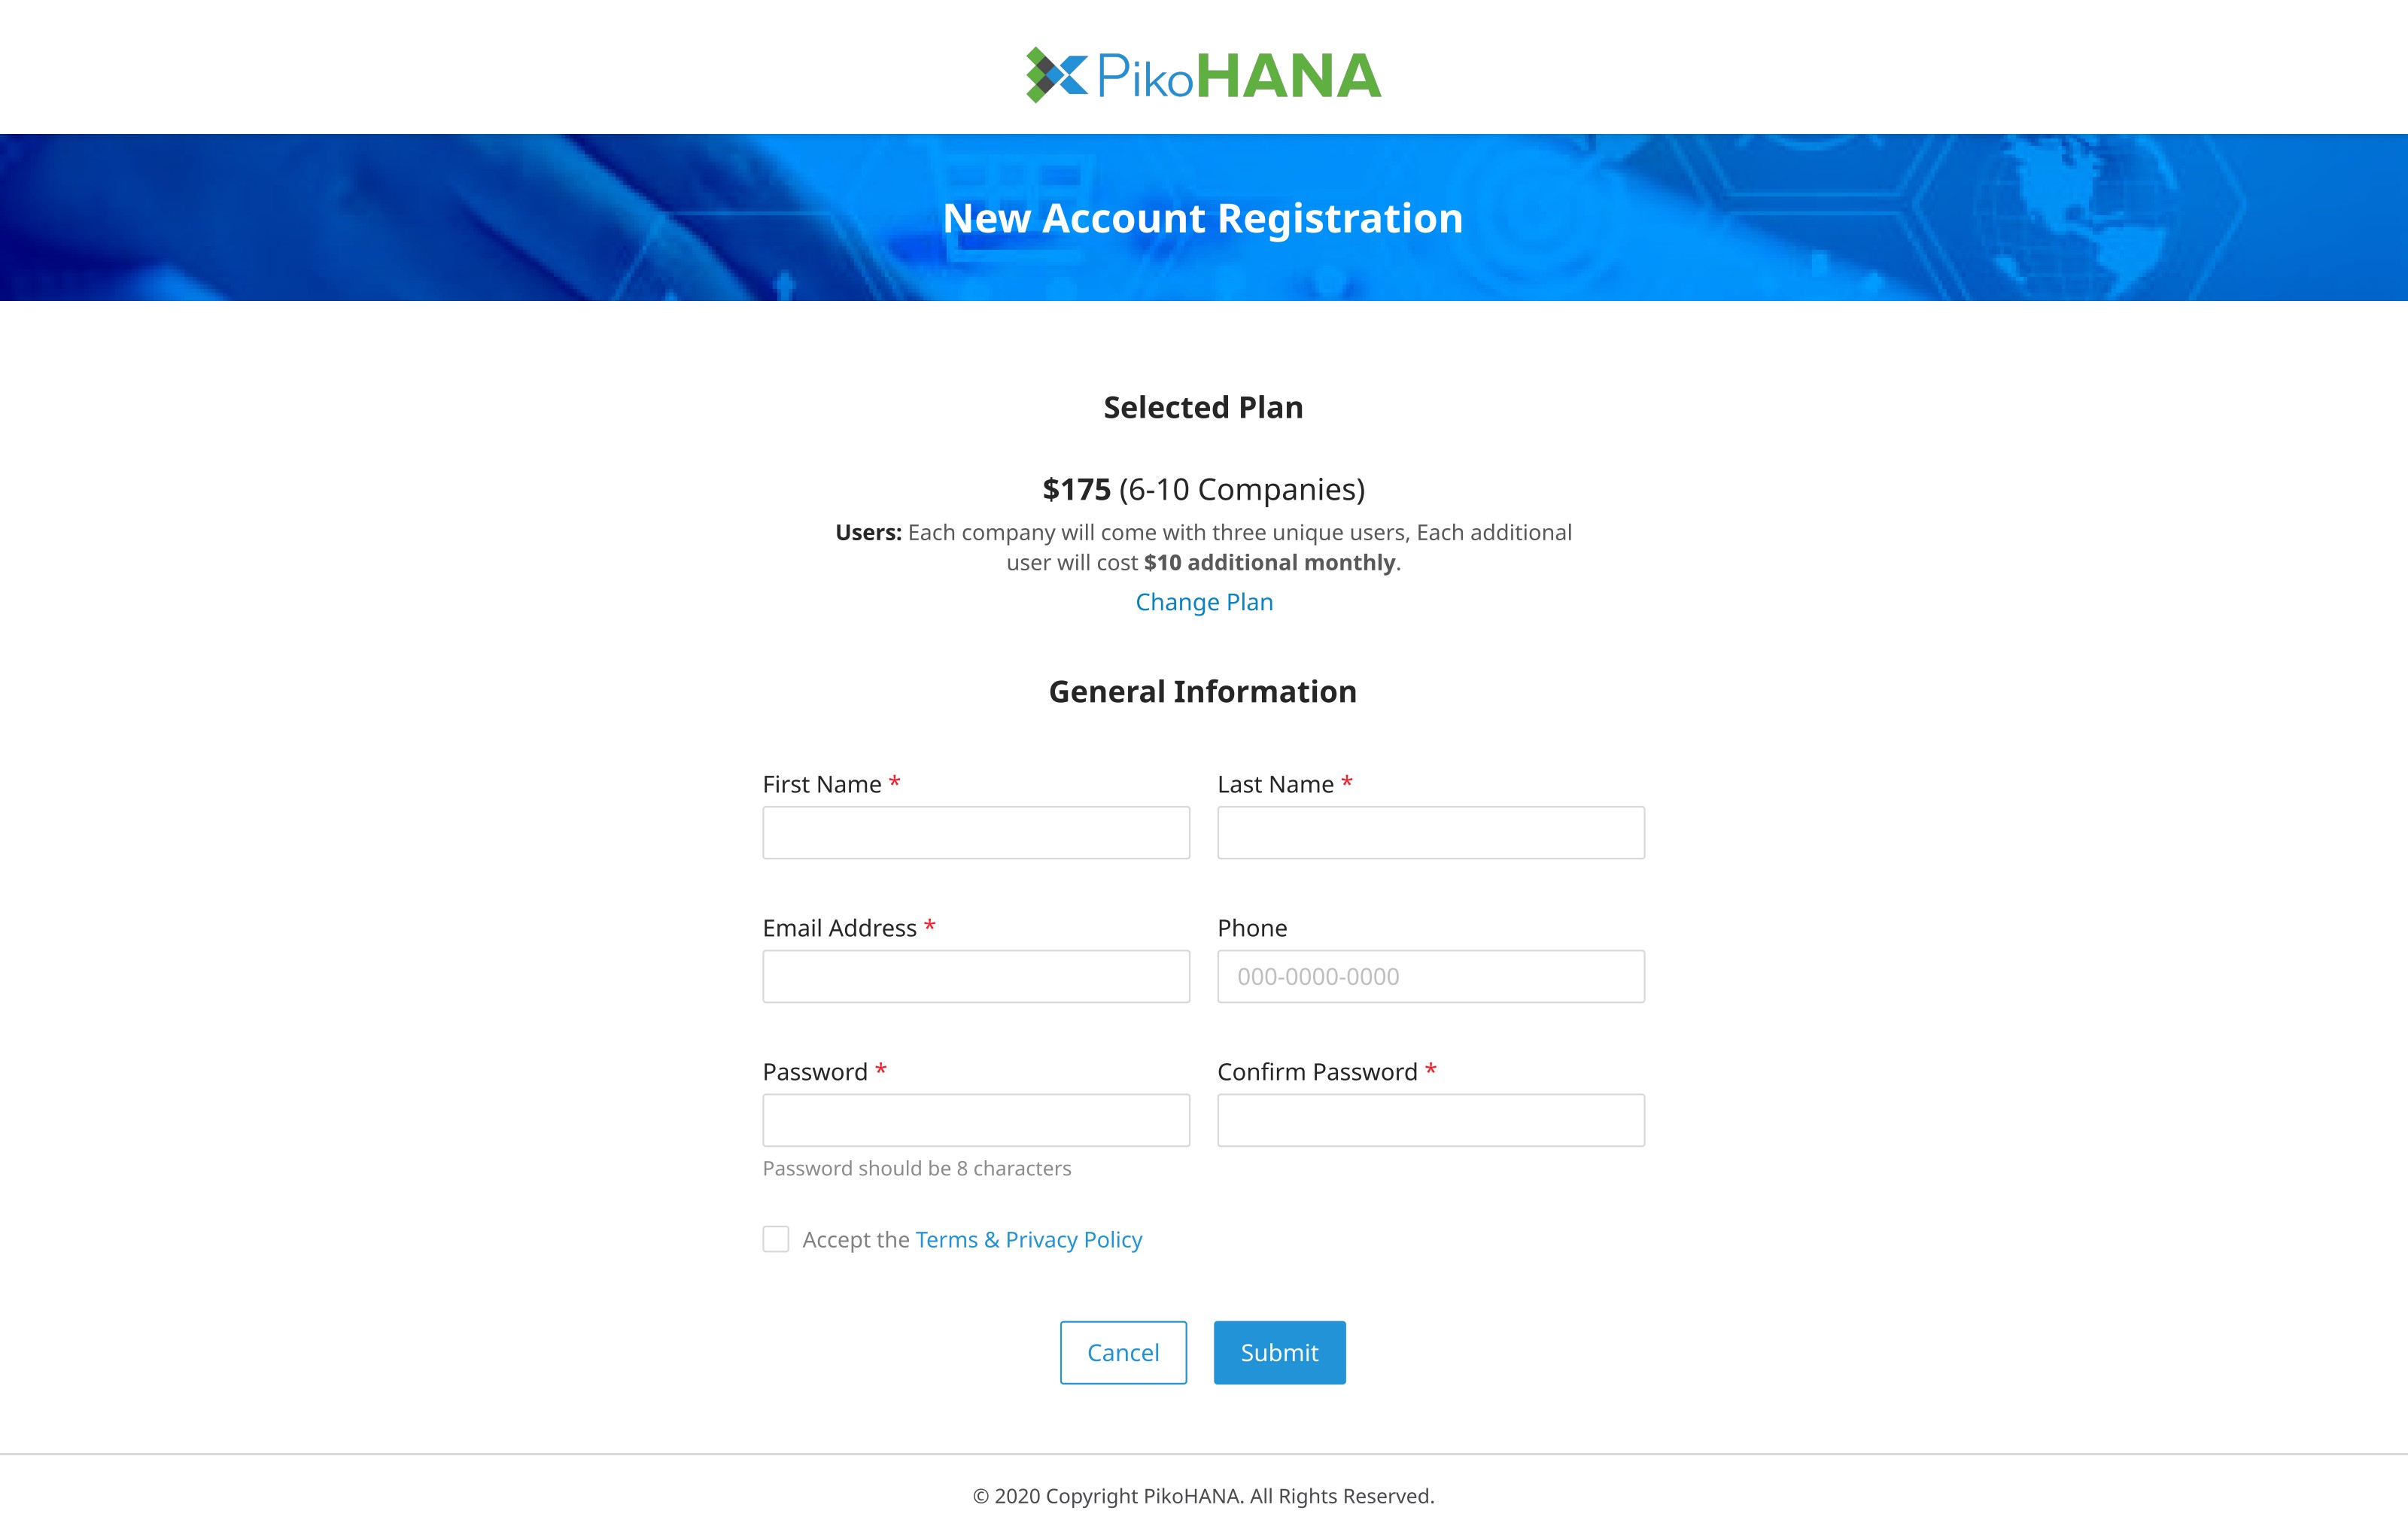
Plan selection during signup (1 / 2–5 / 6–10 / 11–15 companies) reduced friction vs. a separate pricing page.
Discover → Define → Design → Validate.
Shadowed 6 AOs through month-end close. Mapped the spreadsheet → Xero → PDF report loop end-to-end.
Reframed the product as 'one source of truth' — every screen had to answer either 'is this correct?' or 'can I act on it?'.
Three-step onboarding (Company Profile → Update Data → Chart of Accounts), drag-and-drop report builder, consolidated dashboard.
Two rounds of moderated tests on hi-fi prototype. Iterated the CoA builder twice after AOs got lost in long account lists.
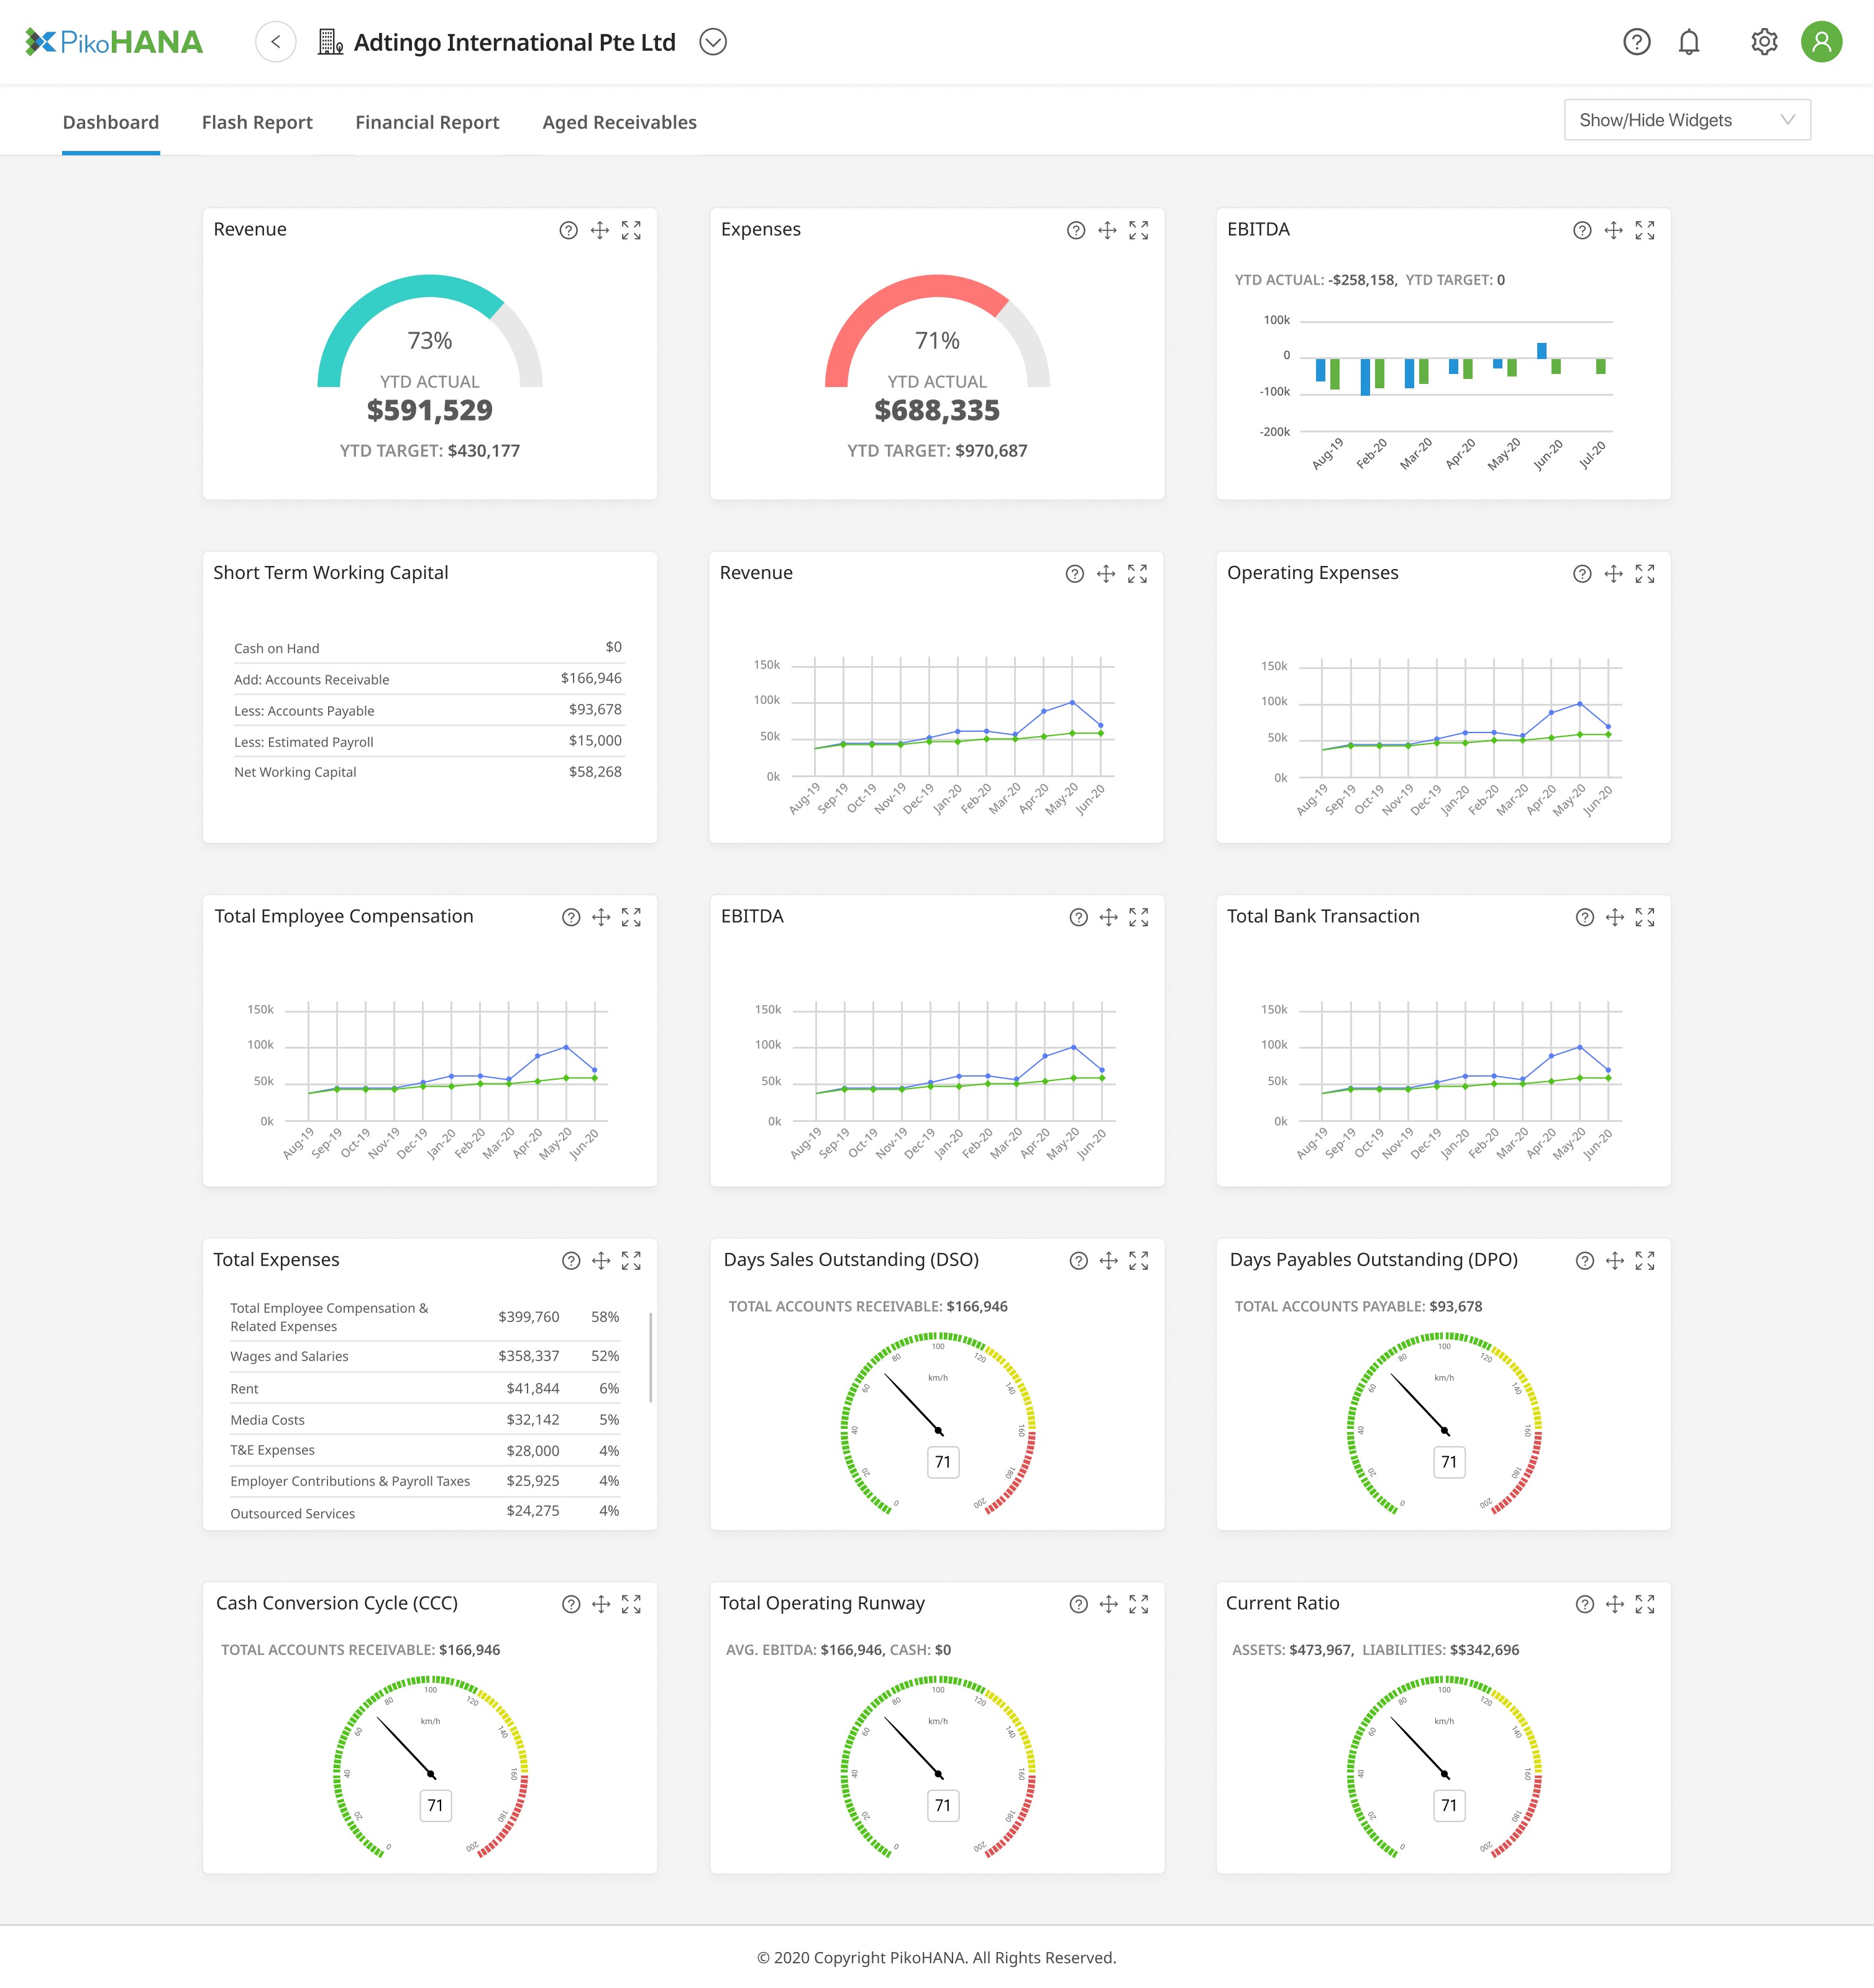
A calm dashboard, a guided onboarding, and a report builder AOs can configure themselves.

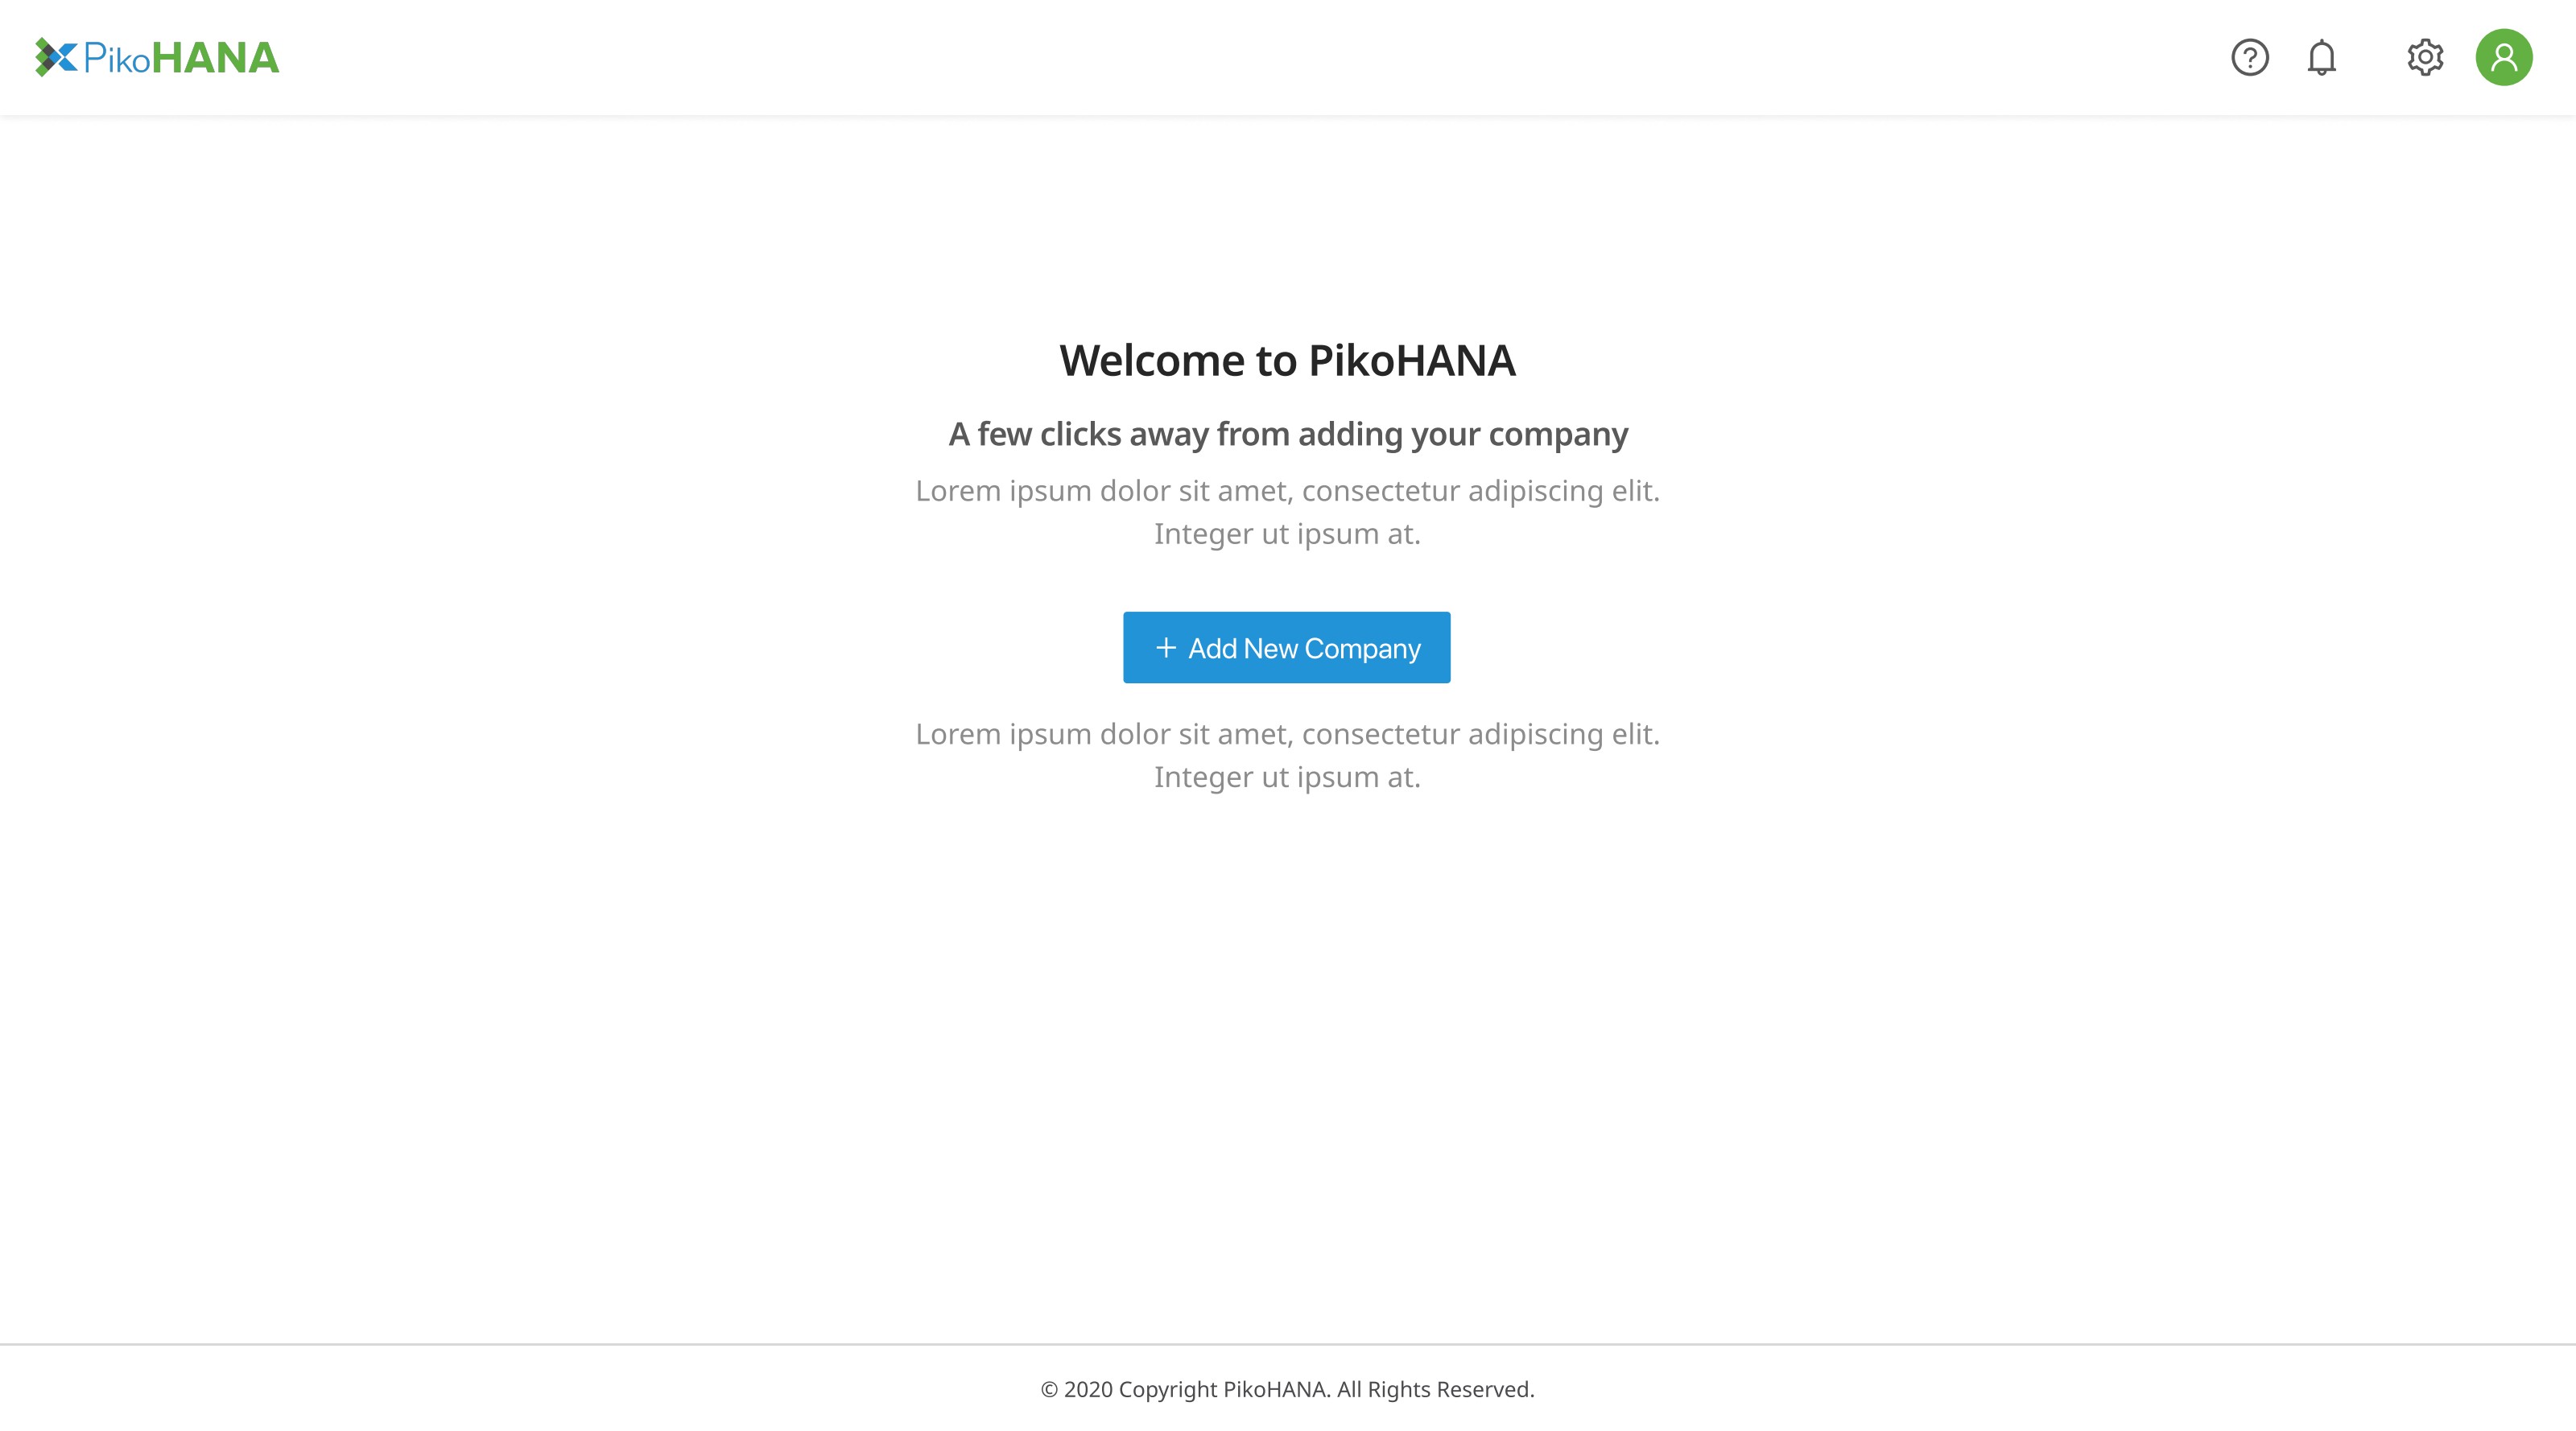
Plan → registration → email verify → add company → import or build CoA. Every step has a visible progress indicator.
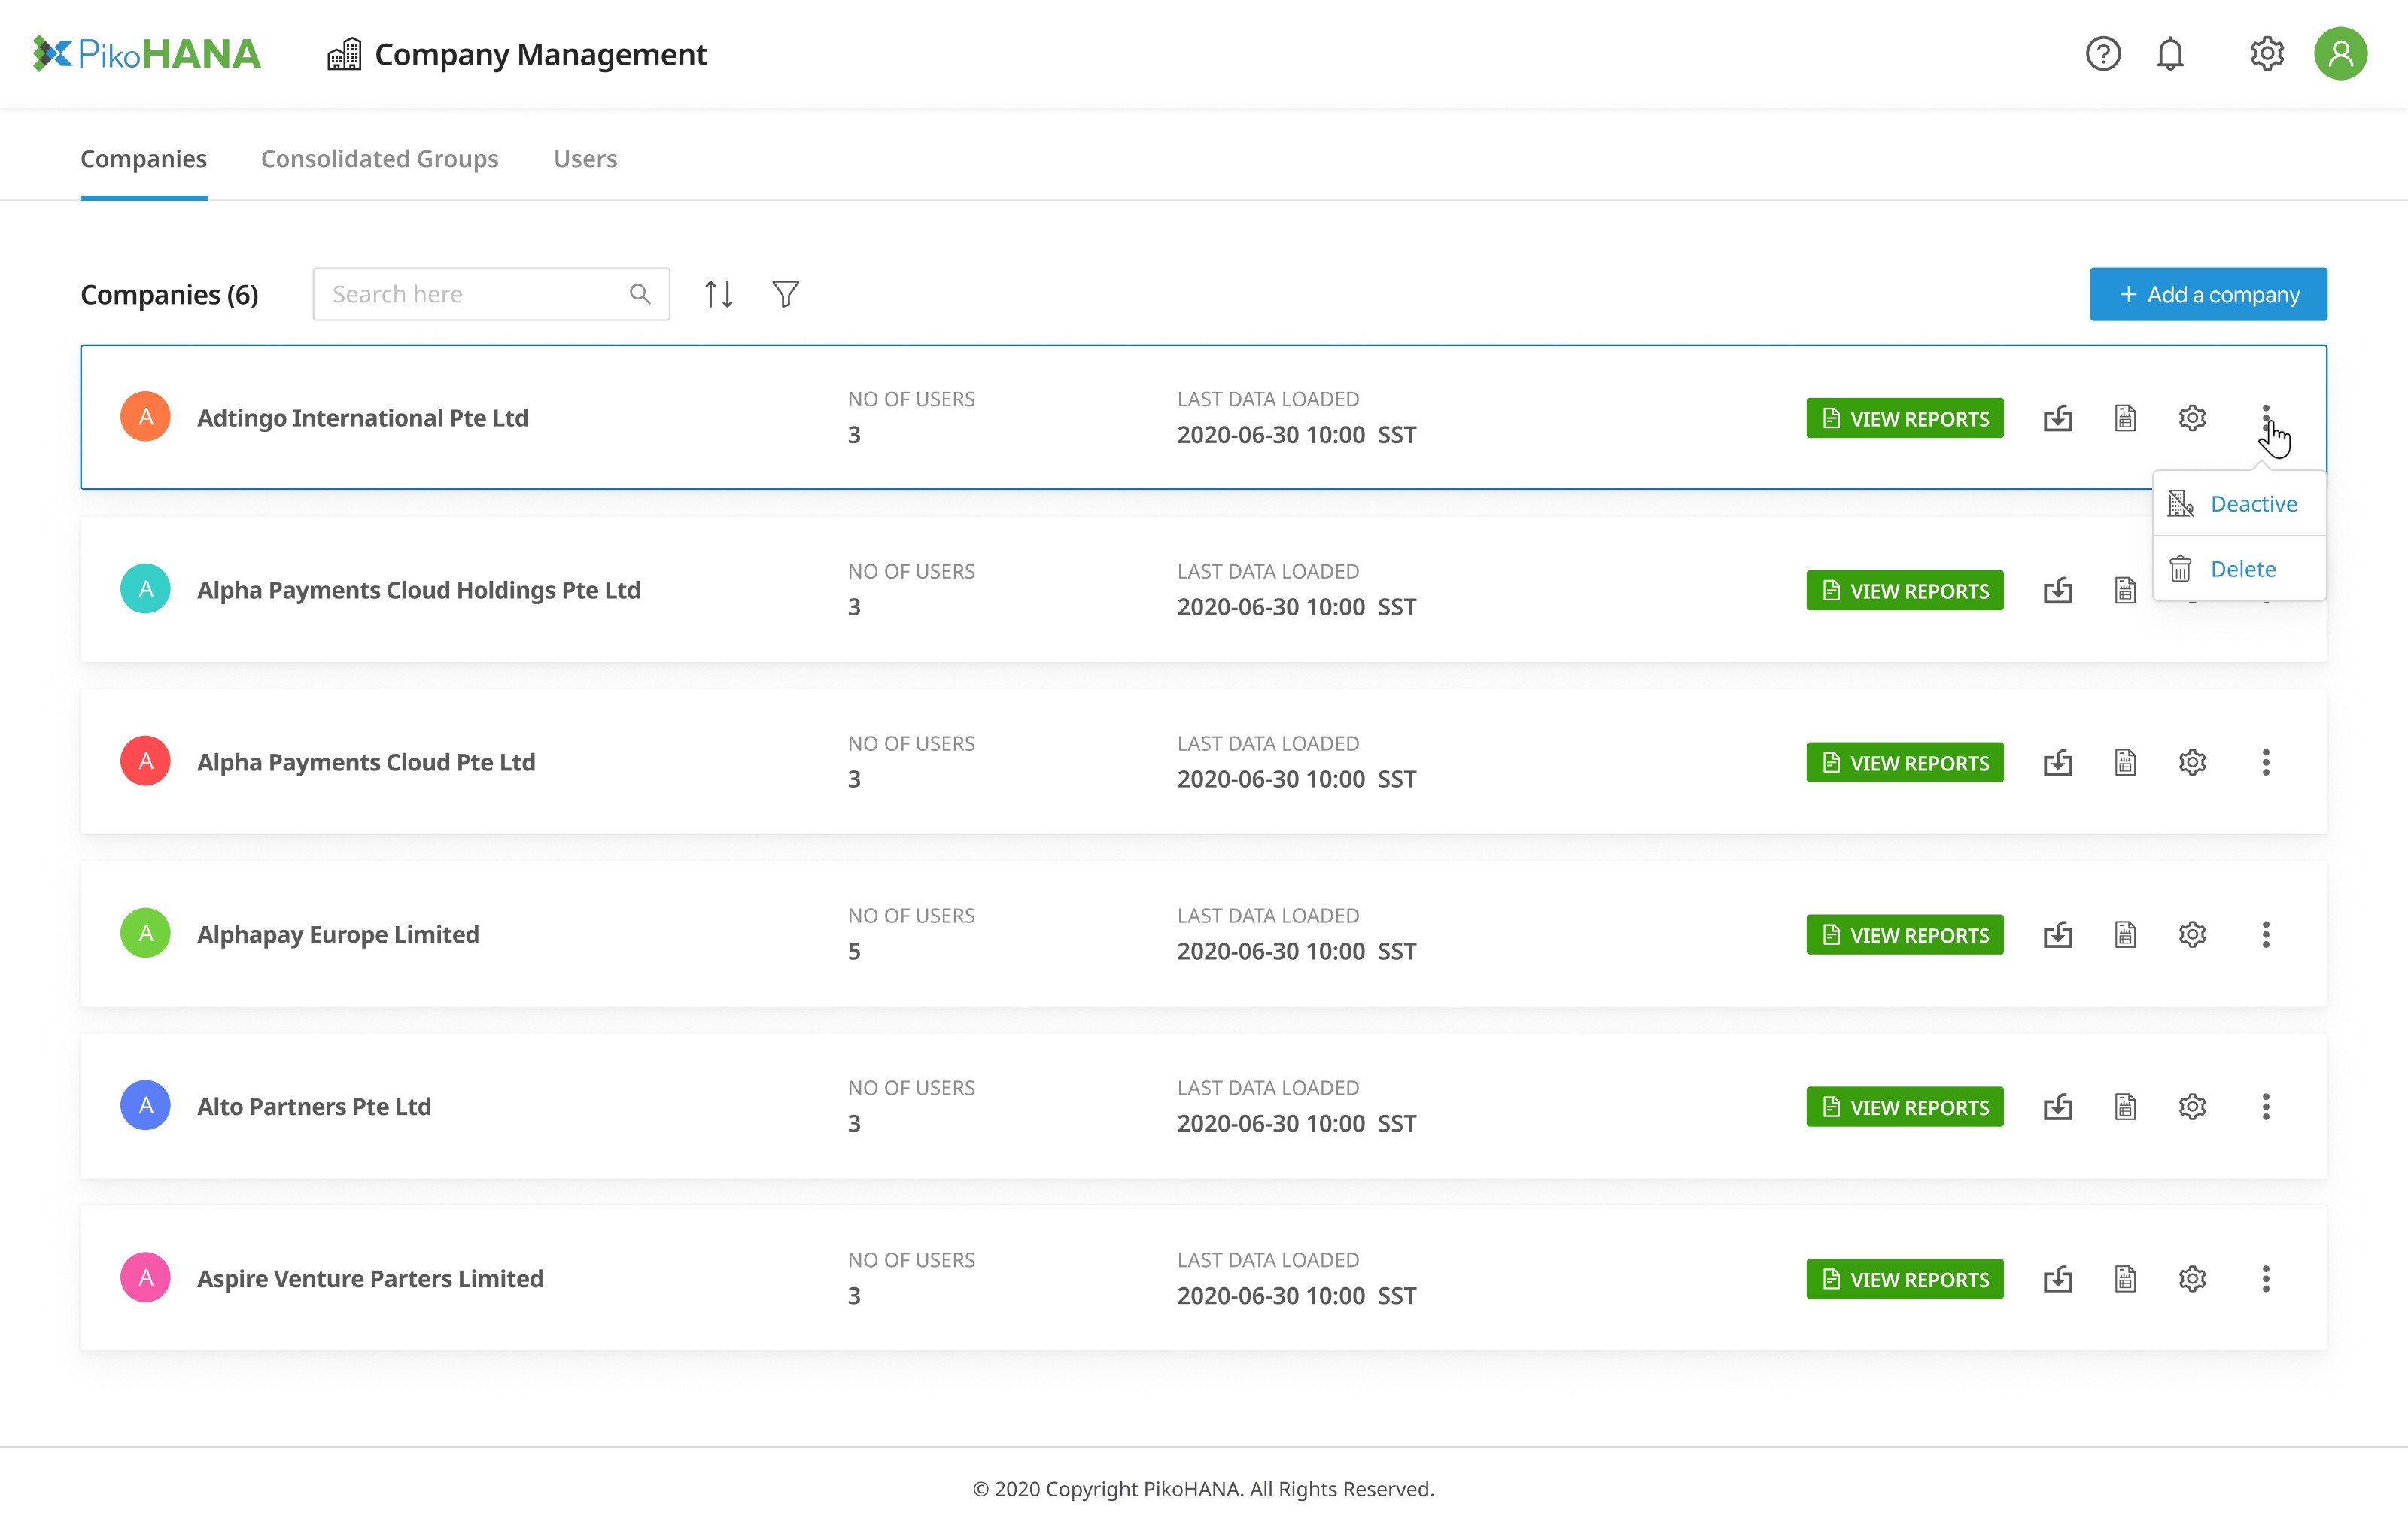
Top-level switcher with consolidated groups, so AOs can move between Adtingo, Cialfo and a group view without losing context.
Drag-and-drop builder for Profit & Loss and Balance Sheet — AOs assemble line items from a left-hand panel instead of editing JSON.
EBITDA, current ratio, revenue mix and aged receivables on one screen. Widgets show/hide per AO preference.
Per-company and per-group permissions so junior staff can update data without touching consolidations.
One-click budget and CoA import from Xero — the data AOs already trust, surfaced inside PikoHANA.
Blue carries the brand and signals action; green flags positive financial states (in-budget, verified, on-target). Type pairs Sora for display weight with Inter for dense tabular reading.
Faster close, fewer clicks, and a product AOs trust to leave open.
- Accounting users will forgive a plain UI but never a wrong number — invest in data lineage cues first.
- Drag-and-drop felt clever in demos but only landed once we added a search + 'recently used' rail.
- Putting plan selection inside the signup flow removed a whole drop-off step we had not seen in analytics.
"I used to keep three spreadsheets open during close. Now I keep PikoHANA open — and a coffee."